This is a place-holder post for later reference when discussing oxygen isotopes and published eustatic sea level curves. The first figure is my compilation of several curves including Haq et al. (1987), which I have manually corrected to the GTS2004 to GT2016 time scales. There were negligible changes for later Palaeogene or Neogene time scales between 2004 and 2016, and so far my examination of GTS 2020 is the same. The 1987 Haq curve was shifted to match the Haq and Al-Qahtani (2005) curve.
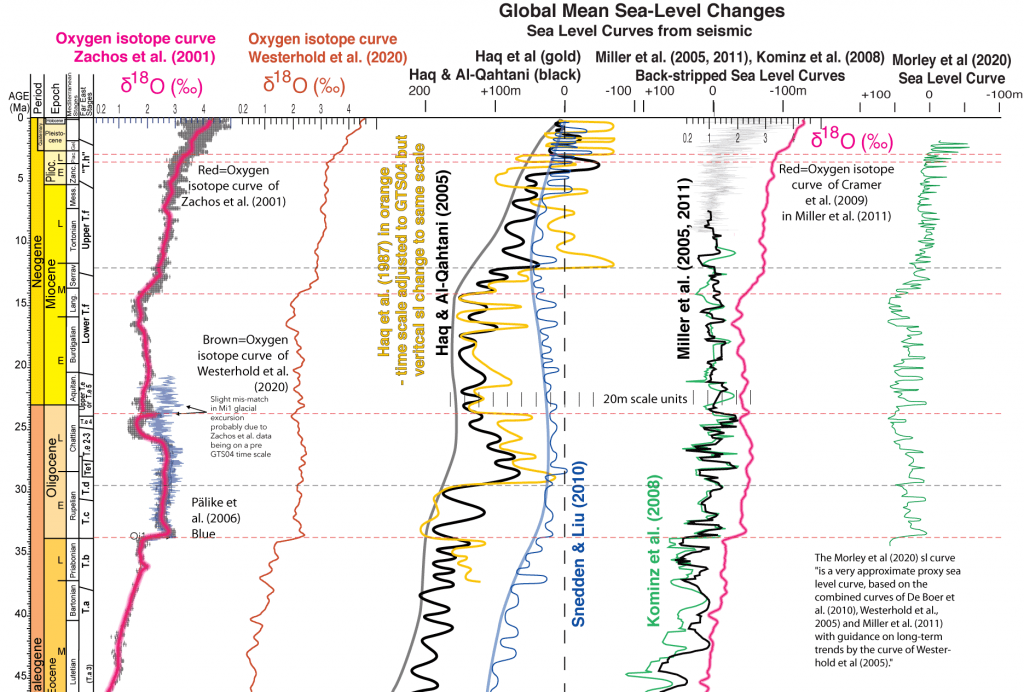
The Zachos et al. (2011) oxygen curve has a notable shift in the Late Oligocene that has not been replicated by later studies. This disregarded shift has been cited in studies on the West Natuna Basin as a rise in global temperature and therefore eustatic sea-level rise at the Gabus to Barat Fm. or Cau to Dua Fm. (Nam Con Son) boundary (e.g. Morley et al., 2011; although corrected in later papers). It also featured in Mathew et al. (2020, Figure 1) in a review of the South China Sea, even though by then this excursion had been discounted by most workers.
The Haq group (1987, 2005), Snedden and Liu (2010), Miller et al (2005, 2011) and Kominz et al. (2008) global sea-level curves show considerable variation (although the Miller and Kominz curves are similar as they employed similar methods in similar areas).
Note that I have added a scale bar near the base of the Miocene showing ticks for 20 m sea-level changes. Snedden and Liu (2010) have many Oligocene and Miocene sea-level changes of 20 to 30 metres , Miller and Kominz tended to interpret a little larger, as typically 30-40 metres. Haq and co workers are often much larger, but un-replicated. However around SE Asia there are many non-Waltherian contacts where juxtaposed facies were deposited in settings with 200 m of more environmental contrast. More on these examples in a later post, but some already published such as Lunt (2019).
The figure below is from Westerhold et al. (2020) which is annotated with interpreted climatic event, especially the growth in polar ice sheets that depleted the oceans in 16O.
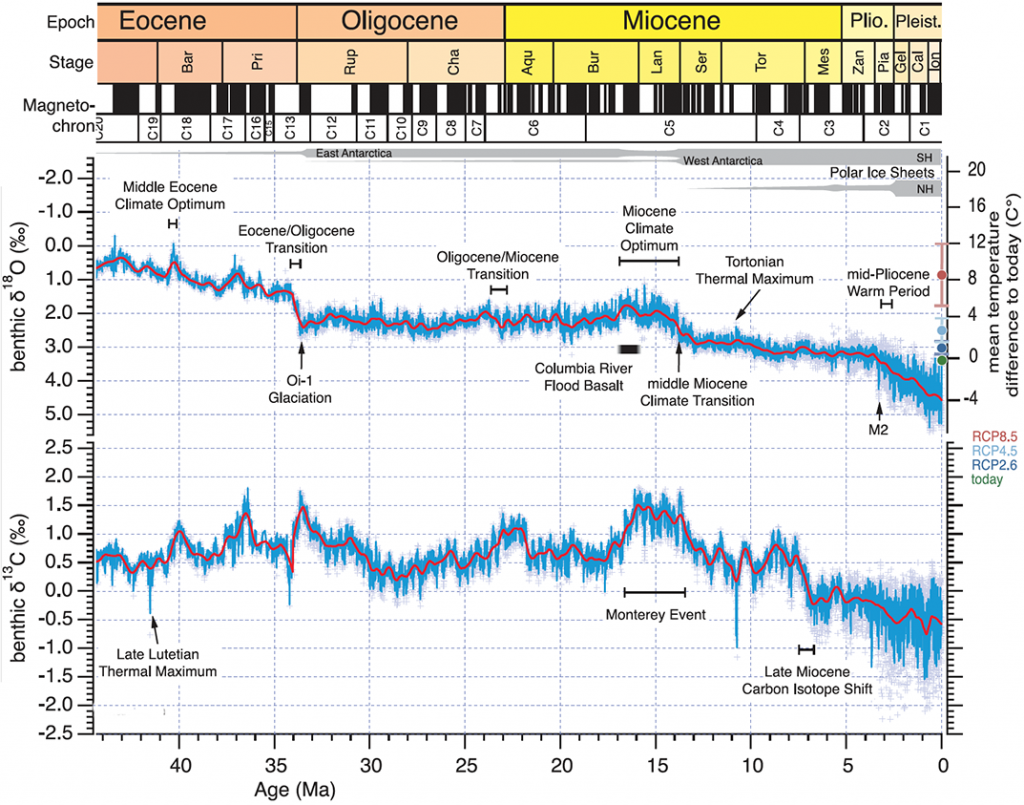
Note that on the Westerhold et al. (2020) curve, the Mi1 spike near the Oligo-Miocene boundary on Zachos et al. (2001), attributed to a small glacial event, is no longer present. It is debatable if it is present on the Cramer et al. (2009) curve.
Westerhold et al. note the M2 marine isotope stage began at 3.3 Ma, which was the first northern hemisphere glaciation. This tallies with the mid Pliocene onset of rapid sea-level fluctuations mentioned by Lunt (2021) in the Malay and West Natuna basins, notably absent from earlier sediments.
References
Haq, B.U., Al-Qahtani, A.M., 2005. Phanerozoic cycles of sea-level change on the Arabian Platform. GeoArabia 10, 127-160
Haq, B.U., Hardenbol, P.R., Vail, P.R., 1987. Chronology of fluctuating sea levels since the Triassic. Science 235, 1156-1167
Kominz, M.A., Browning, J.V., Miller, K.G., Sugarman, P.J., Misintseva, S., Scotese, C.R., 2008. Late Cretaceous to Miocene sea-level estimates from the New Jersey and Delaware coastal plain coreholes: An error analysis. Basin Research 20, 211-226
Lunt, P., 2019. Partitioned transtensional Cenozoic stratigraphic development of North Sumatra. Marine and Petroleum Geology 106, 1-16
Lunt, P., 2021. A reappraisal of the Cenozoic stratigraphy of the Malay and West Natuna Basins. Journal of Asian Earth Sciences: X 5
Mathew, M., Makhankova, A., Menier, D., Sautter, B., Betzler, C., Pierson, B., 2020. The emergence of Miocene reefs in South China Sea and its resilient adaptability under varying eustatic, climatic and oceanographic conditions. Scientific Reports 10(1), 7141
Miller, K.G., Kominz, M.A., Browning, J.V., Wright, J.D., Mountain, G.S., Katz, M.E., Sugarman, P.J., Cramer, B.S., Christie-Blick, N., Pekar, S.F., 2005. The Phanerozoic record of global sea-level change. Science 310, 1293-1298
Miller, K.G., Mountain, G.S., Wright, J.D., Browning, J.V., 2011. A 180 million year record of sea-level and ice-volume variations from continental margin and deep-sea isotopic records. Oceanography 24(2), 40-53
Morley, R.J., Swiecicki, T., Dung Thuy Thi Pham, 2011. A sequence stratigraphic framework for the Sunda region, based on integration of biostratigraphic, lithological and seismic data from Nam Con Son basin, Vietnam. Proceedings Indonesian Petroleum Association Convention 35
Snedden, J.W., Liu, C., 2010. A compilation of Phanerozoic sea-level change, coastal onlaps and recommended sequence designations. Search and Discovery Article #40594,
Westerhold, T., Marwan, N., Drury, A.J., Liebrand, D., Agnini, C., Anagnostou, E., Barnet, J.S.K., Bohaty, S.M., De Vleeschouwer, D., Florindo, F. et al., 2020. An astronomically dated record of Earth’s climate and its predictability over the last 66 million years. Science 369(6509), 1383-1387
Zachos, A., Pagani, M., Sloan, L., Thomas, E., Billups, K., 2001. Trends, rhythms, and aberrations in global climate 65 Ma to present. Science 292, 686-693
[…] aspect discussed above becomes important). However, Morley et al. noted that it coincides with an oxygen isotope shift that should indicate growth in polar ice caps and a global sea-level fall. In contrast, the […]