See also the first post on geohistory plots
In writing many of the new papers it became apparent that I was explaining to the non-specialist the value and application of precision (in light of reality checks on precision, accuracy and trueness). While non-stratigraphic geologists are happy using simple adjectives such as deep marine, shallow marine or Early Miocene, I was always striving to ask whereabouts in the Early Miocene? Or how deep? Deep enough to indicate subsidence relative to another well/outcrop? In other words, the application of techniques to change these vague adjectives into useable measurements.
This is the reason for the geohistory approach. Using relative thicknesses or interpolated age-depth trends to indicate relative magnitudes of the rates of sedimentation or changes in accommodation space. This actually evolved in reverse. In places it was evidence that extreme tectonism impacted stratigraphy and this could be illustrated and quantified on a geohistory plot. They I realised geohistory plots could be used to map out varying magnitude in these tectonic transitions. Age depth curves could be used to estimate more precise ages to the sediments either side of an unconformity.
For example in Luan and Lunt (2021a) the nearby JS 53A and 53B wells show important tectonic movement when analysed this way. Both sites have Eocene reefs deposited at sea level. Then at the 36 Ma, top J30 sequence event, JS 53B remained at sea-level and the reef continued to grow, but 9 km away at JS 53A the reef died and was overlain by bathyal latest Eocene clays. The A location was on the downthrown side of a fault active at 36 Ma. By the end of the Oligocene the A location began to accumulate a J70 sequence Globigerina limestone (OMGL; Luan and Lunt 2021b). However the cross section Cucci and Clark (1993) just showed all limestones with the same brick-type symbol (all white calcareous rocks are the same eh?) and this was correlated by time line to the nearly B location Late Oligocene reef. None of the directly implied movement was captured by this technique.

Then at the Oligo-Miocene boundary, top J70 event, the same fault reversed thrown and the B location was abruptly subsided as part of the major subsidence under the Makassar Straits (Luan and Lunt 2021a). The A site may also have been subsided, but by less, and this differential movement brought the OMGL in the JS 53A to a similar depth as the top Letter Stage Te4 reef crest at JS 53B. A simple flat correlation was approximately possibly and the dimensions of time sand facies could be overlooked by a layer-cake interpretation, with highstands, lowstands and eustatic sequence boundaries forced onto the seismic data
As Richard Feynman said “You can know the name of a bird in all the languages of the world, but when you’re finished, you’ll know absolutely nothing whatever about the bird… So let’s look at the bird and see what it’s doing – that’s what counts.“
Geologists have been distracted by static seismic sections, software, sequence and boundary jargons, names etc and have forgotten the dimensions of facies and time which tell us what the basin and accommodation space were doing. These dimensions are not seen on a seismic section.
The cartoon below shows how this method takes a static view of a reef into a new dimension of knowledge through the geohistory approach. Examples of geohistory plots for the KE 11E are in Luan and Lunt (2021c) and M1 reef in Lunt (2021) and the Sultan-1 geohistory plot will be in a paper in press on the Oligo-Miocene boundary around Sundaland but a draft version is given below
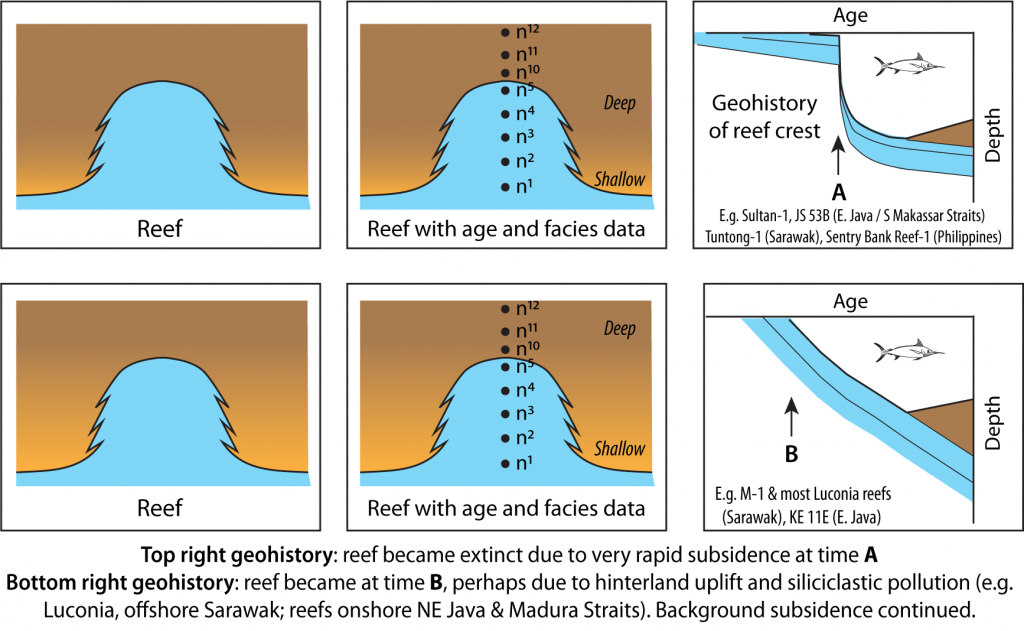
The development of just seeing a reef on a static seismic line, to integrating age and facies data on a geohistory plot, thereby developing a new geological history with broad implications

References
Cucci, M.A., Clark, M.H., 1993. Sequence stratigraphy of a Miocene carbonate buildup, Java Sea. In R. G. Loucks & J. F. Sarg (Eds.), Carbonate Sequence Stratigraphy: recent Development and Applications, 291-303.
Luan, X., Lunt, P., 2021a. Latest Eocene and Oligocene tectonic controls on carbonate deposition in eastern Java and the south Makassar Straits, Indonesia. Journal of Asian Earth Sciences
Luan, X., Lunt, P., 2021b. Occurrence in space and time of the Globigerina-sands of eastern Java; their stratigraphy, and controls on reservoir quality. Marine and Petroleum Geology
Luan, X., Lunt, P., 2021c. Controls on Early Miocene carbonate and siliciclastic deposition in eastern Java and south Makassar Straits, Indonesia. Journal of Asian Earth Sciences
Lunt, P., 2021. Tectono-stratigraphic framework of Luconia carbonates. SEPM Special publication, Cenozoic Isolated Carbonate Platforms – Focus Southeast Asia
Be First to Comment