See also the post on environment of deposition from planktonic foraminifera
This is an introductory post on determining environment of deposition. An important and complex subject I am sure will crop up again. Examples here show that we have much to learn from facies interpretation in a stratigraphic context.
Determining environment of deposition is important for tracing facies, and natural successions following Walther’s Law; and the breaks in such gradual sequences. Many properties of environment of deposition are related to water depth, which has roughly linear relationships to energy, light and many other properties that affect sedimentary processes.
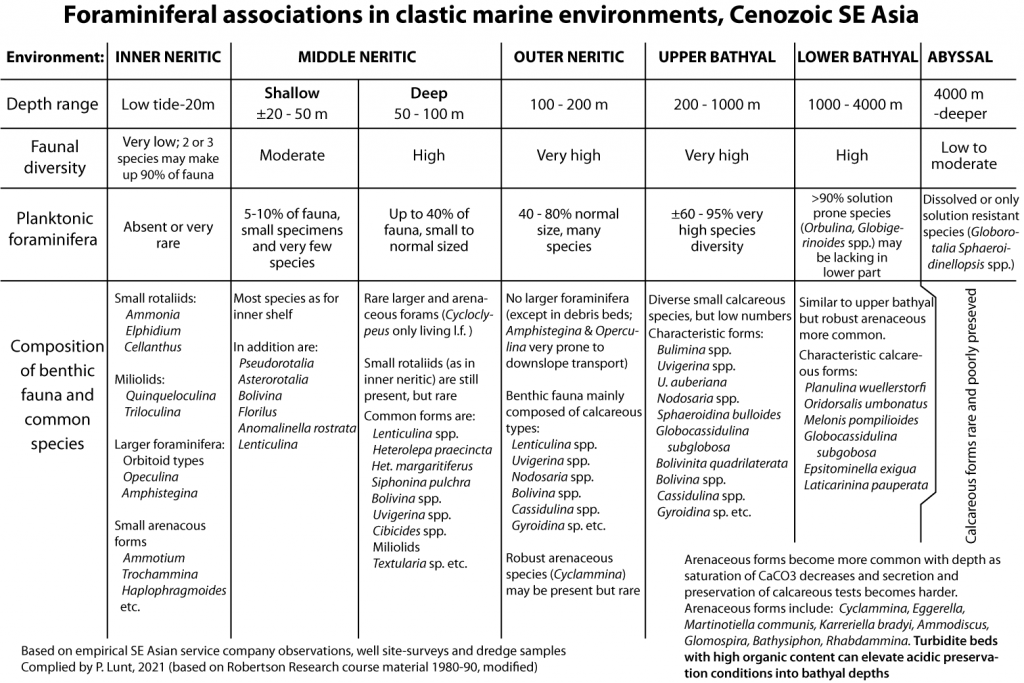
The Cenozoic of SE Asia has diverse, tropical, benthic microfossils and these can be used to determine environment of deposition as many taxa are extant, with well understood relationships to facies and depth, as well as empirical facies distribution data from the sedimentary record. Many times in SE Asian geological studies there are stratigraphic records where thick, consistent facies indicative of, say, paralic or non-marine sediments are abruptly overlain by a thick section of bathyal clays. Such a step-like change in palaeobathymetry is a reliable observation of sudden subsidence (as at a break-up type unconformity) in the order of several hundred metres. These are the classic non-Waltherian contacts that are found repeatedly across the region during the Eocene to Early Miocene extensional phase of tectonic development. Usually there is no missing section at the lithofacies transition as the subsidence did not lead to erosion (except very locally where tilted fault blocks rotated slightly before subsidence)
For workstation geologists, clays are assigned a symbol or colour, and then largely forgotten. However grain-size alone does not determine a sedimentary facies. In East Java under the present day Java Sea the clays deposited above the Kujung Unit I limestone contain a few larger foraminifera and also some shallow marine benthic taxa, but very few planktonic foraminifera. To the south, under modern-day Java island, where subsidence was far more pronounced, the Kujung Unit I platform or reefal limestones are overlain by similar looking clays but these contain outer neritic or upper bathyal benthic foraminifera. Two very different clay facies, reflecting very different tectono-stratigraphic histories.
I remember days on rigs using standard colour palettes and wondering if a claystone was olive-grey or green to brownish grey. At the time such pedantry seems rather “sciencey”, good observation and all that. However this subtle subdivision of colour is really not important (and is also greatly affected by the illumination of each type of microscope light). What is important but overlooked is the microfossils and sometimes accessory minerals that might contain (glauconite and sphaerosiderite=siderite micronodules). But once a company manual dictates the rules of description, the lowly geologist on a rig is not likely to challenge the instructions of work. The Cenozoic of SE Asia is blessed with microfossil faunas that can tell a worker so much about facies and geological history (considering that 80% or more of the section drilled is likely to be some kind of olive grey to medium grey claystone).

If someone could invent a wireline logging tool that could determine this type of data, it would make a fortune. Instead, the guys on the rig-site, who know about the speed of drilling, the quality of the cuttings samples, uncertainties about lag time, wash-out or caving, should be in an enviable position to watch a facies and stratigraphic story unravel under their microscopes, but they are not trained to do this. There is a gap in observations, as the micropalaeontologist in the labs sometimes has not even been told basic data like casing depths, if the last casing reach the intermediate TD, if the sample was below kicking-off through cement into a new sidetrack, and so on. Usually the obvious changes stand out, and the biostratigraphy chart records the non-Waltherian contact over a break-up unconformity, but un-questioning logging of caving, or not considering stratigraphic context, will blur the abrupt nature of the transition. This is not a theoretical risk, and sadly it is more common than not if work is outsourced, and incentives are on a price-per-slide contract. On rig-site the alert geologist can make a note to take sidewall cores over the contact to confirm the precision of the break – which is a major sequence event. But we do not live in this ideal world, and data is invariably degraded, suboptimal, “munged”.
An example of “munged” environmental data

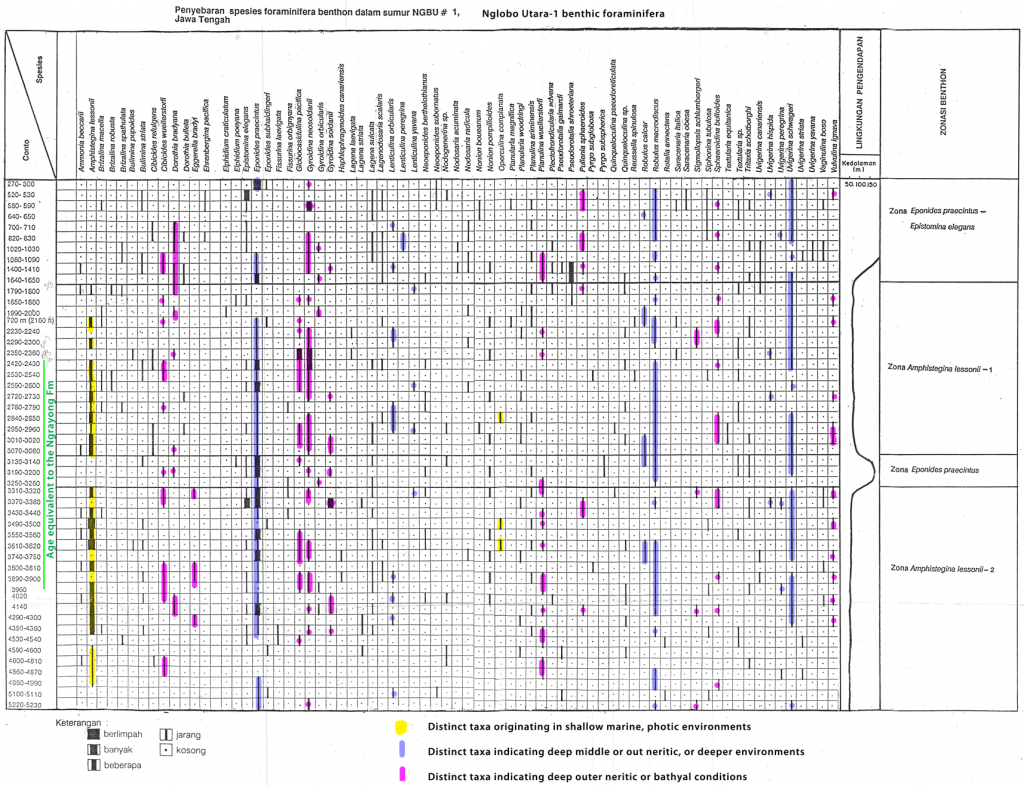
An example of munged data is the well Nglobo Utara-1 (NGBU-1) that drilled through the Ngrayong Formation near Cepu in NE Java, not far from where the Ngrayong Fm. sand is a reservoir for oil in the Kawengan field. The NGBU-1 is a one of the few modern era wells with biostratigraphy available in this area, where the environment of deposition of the Ngrayong has been so widely discussed (Ardhana, 1993). The data chart above interprets generally shallow marine conditions (“Lingkungan pengendapan“= depositional environment and “kedalaman” =depth) of around 50 m, but within this succession there were sudden transgressions to environment “estimated to be more than 400 m deep” (“diperkira berada pada lingkungan berkedalam lebih dari 400 m“), for the sections where Amphistegina is not found. There is a 100 m thick section with deposition at these depth then conditions returned immediately to shallow marine (<50m). This sudden polarisation of palaeobathymetries without intermediate environments, is a violation of Walther’s law, but it got into the stratigraphers final report! Even if a sudden massive transgression and then equal regression was true (and for some reason there were no samples from the intermediate facies) such a massive sea-level change would be seen in adjacent wells and outcrops, and on seismic, and be an important “flooding surface” for correlation.
Of course the real answer is that the entire section is deep marine. The Amphistegina that lived in shallow, photic settings has been carried downslope along with the sand grains. A pause in downslope transportation of the coarser grain sizes occasionally happened, and then only the deeper marine fossils were preserved. There is no need to invoke such dramatic relative sea-level changes of several hundred metres.
The Balung Beds in southeast Sabah

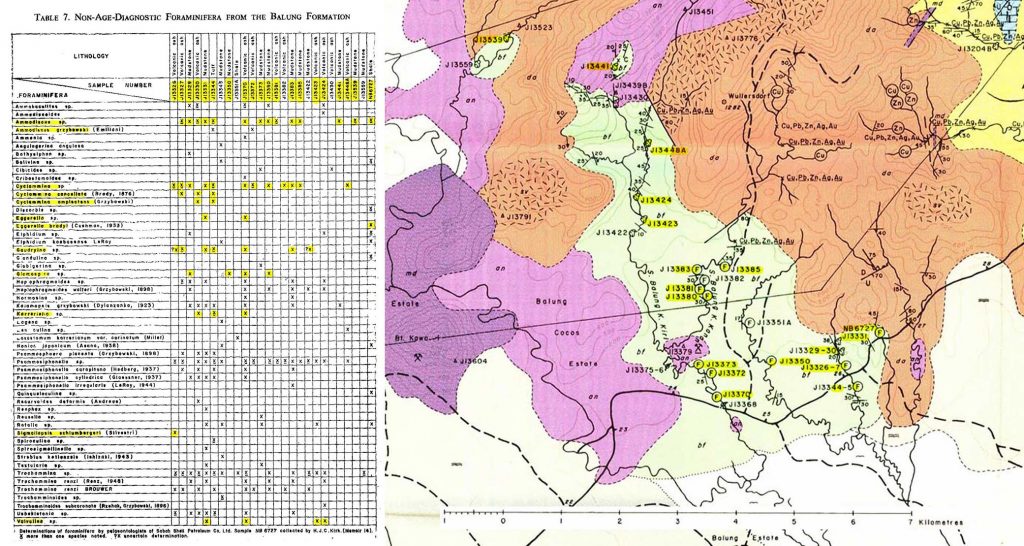
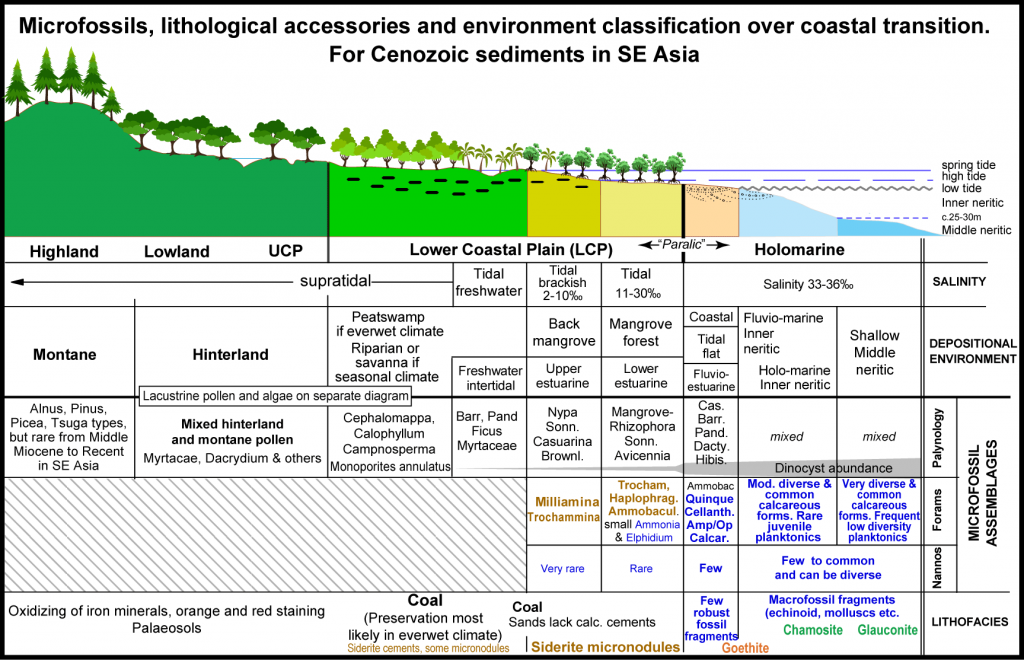
The Balung Beds are an outcropping unit several kilometres thick in NE Borneo (SE Sabah), with high TOC (total organic carbon; abundant plant material) and they were published as a tidal swamp deposit (Lim, 1981), containing arenaceous foraminifera (the tidal setting in the Figure below), but the actual species of foraminifera present (as identified on the data chart in the same report by Shell’s labs in Sabah, shown above) were bathyal to abyssal (see right hand side of first Figure here). Confidential well reports Tawau Offshore-1 and -2, just 25 km away, confirmed the deep marine interpretation, but this information is buried as just a few lines in unpublished reports. What subsidence history left such unexpected deep marine deposits in the latest Miocene of NE Borneo? – note on the map above the blue limestone symbol in the top right is the underlying shallow marine, reefal limestone (Sipit or Kunak Road Lst., early Middle Miocene). There is a missing tectonic event here! How can geology progress with such avoidable, poor observation?

The potential from good observations is still un-tapped
There are so many examples of both the power and abuse of this technique in SE Asia that it was one of the reasons I started this blog. I will write these examples up separately and refer back to this and other pages on facies to demonstrate the reliability of observation. As the NGBU-1 example above shows, auditing data back to basic observations is often necessary. A gap in this audit process is that we currently lack a published guide to the modern analogues of fauna and facies, so entries on this blog are a way to publicise service and oil company data.
The charts shown above are based on service company course notes (which I taught for many years). I added a summary in my book on The sedimentary geology of Java, and I will add summaries of classic studies done by academics (usually shallow marine) or oil companies when I get time.
While we lack precision to pick a horizon and say “here the sediments were outer neritic, and just here they were bathyal”, we still have a highly reliable (blindly repeatable) guide to low resolution palaeobathymetry, and especially environmental contrast at sequence boundaries, that has been severely underused in the past.
References
Ardhana, W., 1993. A depositional model for the early Middle Miocene Ngrayong formation and implications for exploration in the East Java Basin. Proceedings Indonesian Petroleum Association Convention 22, 395-443
Lim Peng Siong, 1981. Wullersdorf Area, Sabah, Malaysia. Geological Survey of Malaysia, Report 15, 106pp.
Lunt, P., 2013. The sedimentary geology of Java. Jakarta: Indonesian Petroleum Association. 346pp.
Be First to Comment