See also a second post of geohistory plots
Geohistory plots are burial history plots with the addition of sedimentary accommodation space (palaeobathymetry; cf van Hinte 1978). They are graphical representations and summaries of the sedimentation, uplift and erosion of single sites. They are quantitative, with modern depths translated to un-compacted thicknesses through time, and a sea-floor history that must match the environment of deposition data from palaeontology and sedimentology. By adding all these data types many important cross-checks are possible. The most widely known is that thermal maturity indictors (vitrinite reflectance or similar observations) at known depths, correspond to geothermal gradient (temperate with depth), either now, or at a back-calculated time of maximum burial. If is does not, there is something wrong with the calculation inputs or the analyses.
So many other cross-checks are available, such as lithofacies and rates of deposition. For example hemipelagic globigerine-marls must have had a slower rate of accumulation than enclosing clays (see the MS-1 well, plot in Lunt and van Gorsel 2013, or the L46-1 well in this post). Reefal limestone will accumulate at a rate that must match basement subsidence. Clastics being deposited faster that basement subsidence must contain environmental indicators shallowing upwards as accommodation space diminished. We can project missing sedimentary rates into a time gap represented by an erosional unconformity as far back as the onset of uplift and erosion, and have interpretations suggested and constrained by geohistory and tectono-stratigraphic from offset wells. Geohistory analysis is best done as a widely spaced set of cross-referencing analyses (which is why the Novva software was developed).
Simple examples from SE Asia -stratigraphy
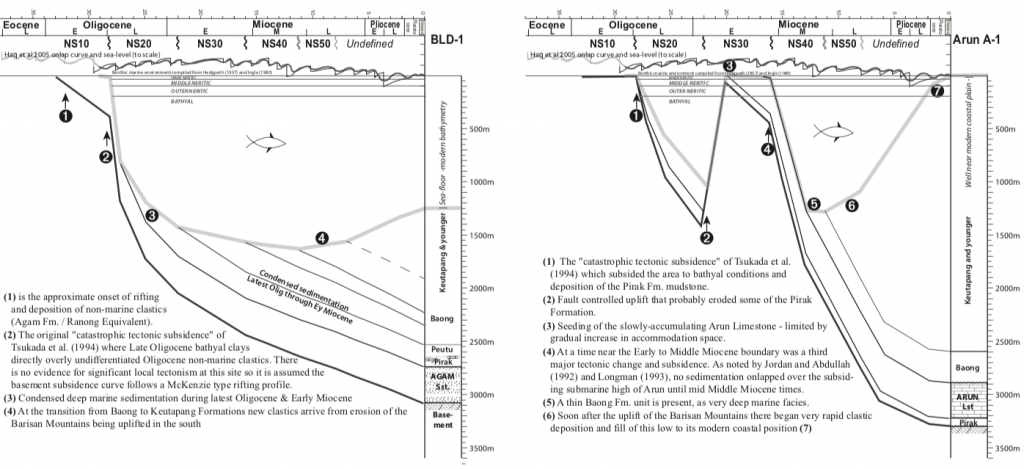
There are excellent examples of geohistory describing dynamic stratigraphy in the tectonically active basins around SE Asia. I used geohistory in my 2019 review of the development of the North Sumatra basin. At least three sets of previous workers (Esso West Thailand, Mobil in Aceh, and Inpex in offshore N. Sumatra) saw a major subsidence event in mid-Oligocene times. Geohistory could plot the magnitude of this change especially in the deep water BLD-1 well that remained in a bathyal setting until the present day. The Arun Field showed that horsts in these bathyal settings were uplifted to have reefs growing on bathyal clays at a time close to the Oligo-Miocene boundary, and after a short period the reef rapidly subsided so that by the end of the Middle Miocene the reef crest was covered by Baong Formation bathyal clays, which with younger formations filled some 2000 m of accommodation space to the present ground level.

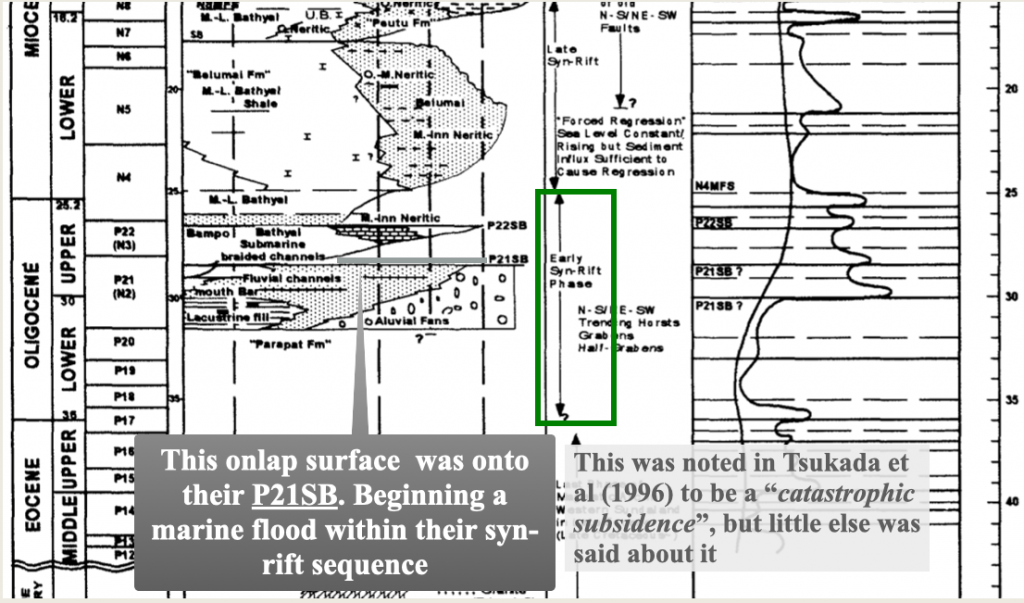
This is an important application of geohistory analysis in tectonically active basins; identifying the natural sequence stratigraphic boundaries. In North Sumatra these had been incorrect picked, such as in Tsudaka et al. (1996 eustasy based; where the mid-Oligocene was implied to include a sea-level fall, but in reality there was a massive rise) and Meckel et al. (2012; a local, undefined, and uncalibrated relative sea level curve assuming rift then sag processes). It is always suspicious (red flag for confirmation bias) if workers think they can see small variations in an accommodation space model, such as implied by the Haq curve, in their data, but they fail to see the massive events where 50,000 sq.km was subsided from delta-top to bathyal in a fraction of a planktonic microfossil zone.

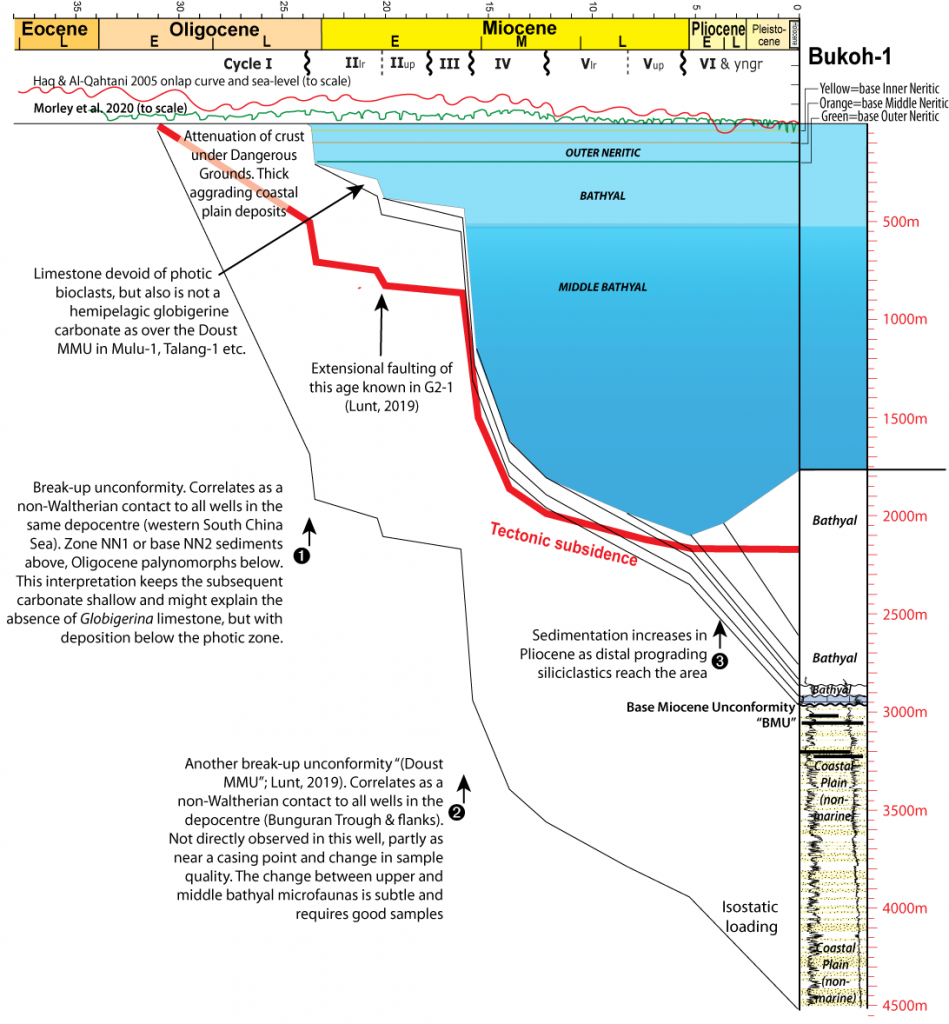
A similar example of using geohistory in establishing a natural genetic sequence stratigraphic framework is in offshore Sarawak. The Bukoh-1 well (data in Morley et al., 2020) is an excellent example as, after a subsidence event on the Oligo-Miocene boundary the area was sediment starved until the Pliocene. Up to the Oligo-Miocene boundary thick deltaic clastics had been deposited, and this stopped at the Oligo-Miocene unconformity. Picking the highest Oligocene palynomorph has been inconsistent. At least two sets of analyses were carried out and “top occasional” Meyeripollis naharkotensis (the Oligocene marker) and “top rare” specimens were picked at two different depths by two sets of workers. This stratigraphic problem is solved by the knowledge that around the same depocentre several wells always see earliest Miocene sediments (as old as N4 or NN1 or lower NN2 in deep marine faunas) above the unconformity. The event marks an extremely rapid retreat of an entire sedimentary system from the whole basin, and therefore Walther’s Law dictates that such a rapid event must be a primary correlation surface, and close to a time time (you can’t have an entire delta plain siliciclastic system disappearing from one part of the basin, but in that newly bathyal part, some sites continued to have rapid deposition of shallow marine clastics; facies in time have to balance in space).

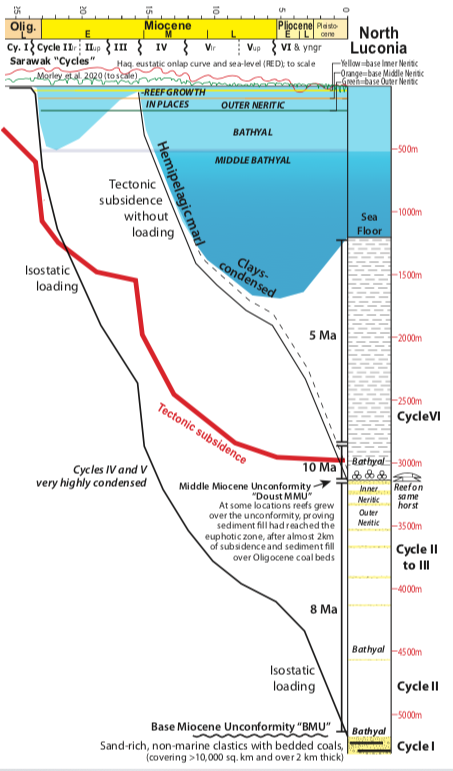
The geohistory for Bukoh-1 shows the abrupt nature of the non-Waltherian contact very clearly as there was negligible overburden deposited after this event, so almost no subsidence due to isostatic loading (some slight load from the increased water column). On the geohistory plot we know the current depth of the sea floor and that there are Oligocene coal beds some 3 km below present sea-level. Data from North Luconia (Lunt, 2019) has been used to help interpret the middle section as near Mulu-1, Tuntong-1 and Kerek-1 (c. 90 km south of Bukoh-1; figure below) we know the Oligo-Miocene event led to rapid sedimentation in a newly created graben that filled back to sea-level, a surface upon which the small Tuntung reef grew when subsidence accelerated again. This second c. 16 Ma subsidence was also very rapid, terminating the small reef and again a massive sedimentary system retreated, so that condensed, bathyal hemipelagic material was deposited over the horsts until the Late Miocene.

On the geohistory plot for Bukoh-1 I have interpreted smaller tectonic subsidence at the Oligo-Miocene boundary event because the subsequent limestone was neither a photic sediment nor a middle bathyal hemipelagic chalk. However the total of these two tectonic events (plus a speculative minor event at about 20 Ma, See G2-1 in Lunt, 2019a) is constrained by the geohistory plot. That is; between roughly 24 and 14 Ma the accommodation space at Bukoh-1 must have increased in abrupt steps by a total of almost 2 km, and this was driven by tectonism, not loading.
This identification and testing of a quantitative history of subsidence, sediment supply, loading, accommodation space and lithofacies is just one aspect of geohistory analysis. Multiple wells supply data to produce an evidence-based regional framework. The importance of this can be demonstrated by the plotting the sea-level curves of Haq and Al-Qahtani (2005) and Morley et al. (2020) along the time axis, to vertical depth scale and tied at 0 for the present (on the North Luconia and Bukoh-1 geohistory plots above). This shows that the changes in accommodation space across offshore Sarawak are dominantly controlled by tectonics. If eustatic variation has any sedimentary expression, it is at a scale that is very small – i.e. para-sequence type detail. Yet the tectono-stratigraphic framework has not been investigated for many decades as people tried to recognise the global “TB” sequence boundaries. This important gap in our knowledge was due to a lack of quantitative approaches such as geohistory analysis
The power of geohistory analysis grows as other disciplines of data are added. A paper in press discusses the effect of isostatic loading of eastern Java south of the Kujung Shelf edge, which forced subsidence an consequently developed the Madura Straits reefs (such as the BD field) into high pinnacles. Such isostatic loading is localised, as are these high relief reefs. It appears to have been an acceleration of the high sediment supply that caused the loading that eventually terminated the reefs close to the early to Middle Miocene boundary. (I shall add a post on this paper shortly).
Geohistory analysis means that a quantitative view of the sedimentary system evolves, tied to an active tectonic history, and leading to a highly detailed and robust model of facies deposition that can be supplied to basin modellers. Geohistory analysis is far more than a pre-basin modelling tool. It should be the foundation of evidence-based geology in tectonically active basins.
References
van Hinte, J.E., 1978. Geohistory Analysis – Application of Micropaleontology in Exploration Geology. AAPG Bulletin 62(2), 201-222
Lunt, P., 2019a. A new view of integrating stratigraphic and tectonic analysis in South China Sea and north Borneo basins. Journal of Asian Earth Sciences 177, 220-239
Lunt, P., 2019b. Partitioned transtensional Cenozoic stratigraphic development of North Sumatra. Marine and Petroleum Geology 106, 1-16
Lunt, P., van Gorsel, J.T., 2013. Geohistory analysis of South Makassar. Berita Sedimentologi 28, 14-52
Meckel, L.D., Gidding, M., Sompie, M., Banukarso, M., Setoputri, A., Gunarto, M., Citajaya, N., Abimanyu, A., Sim, D., 2012. Hydrocarbon systems of the offshore North Sumatra basin, Indonesia. Proceedings from Indonesian Petroleum Association: 36, 1–11
Morley, R.J., Hasan, S.S., Morley, H.P., Jais, J.H.M., Mansor, A., Aripin, M.R., Nordin, M.H., Rohaizar, M.H., 2020. Sequence biostratigraphic framework for the Oligocene to Pliocene of Malaysia: High-frequency depositional cycles driven by polar glaciation. Palaeogeography, Palaeoclimatology, Palaeoecology 561, 110058
Tsukada, K., Fuse, A., Kato, W., Honda, H., Abdullah, M., Wamsteeker, L., Sulaeman, A., Bon, J., 1996. Sequence stratigraphy of the North Aceh offshore area, North Sumatra, Indonesia. Proceedings from Proceedings Indonesian Petroleum Association Convention: 25, 29–41
Looks good Pete! Already contains a lot. Are you are going to keep adding material?
Still a lot to do, including correcting myself. Eventually the posts will become less frequent but I will try and tidy them up and cross-reference them more
If you’re going to get students involved more you may need to streamline the registration for comments.
For geohistory, some more examples would be good, and some guidance on how to build them
Yes. It’s on the “to-do” list. I need to refine the process as I get emails galore from the system for every “ping-back” (when someone cross-links a page), and every time a comment is posted. I don’t want to over-fill my mail box. Too many unread emails is not a nice start to the day, even if they are mostly machine generated.
For geohistory analysis I used to use a Mac back-stripping application as an imported layer in Illustrator, and draw over it. Now I am switching to Doug Waples’ Novva – which is PC based (and I am a die-hard Mac user). Doug and I want to do courses on geohistory as there is a slight learning curve, and one has to organise one’s thoughts and data. Also learning to recognise the implications from the plots and test them is a bit of a skill. It is a change in mindset for many geologists. But yes, more examples is a easy way to get people to think in the dimensions of depth and time – and for me, the geographic variation in these properties. A couple of the new papers have some interesting geohistory plots and I will post these later, with overviews of the paper and what the geohistory means for general geology and exploration. Geohistory is NOT just 1D basin modelling!